This is a quick section on how to get weird symbols onto your plot labels, mainly because I want to write the rules down somewhere before I forget. R has built in functionality to put all sorts of weird mathematical expressions on plots, see the help page for plotmath for a long list of things that are possible. I’m using expression to create the labels because it seems to be the simplest option I’ve found so far.
| Character | Meaning |
|---|---|
| ~ | separate with a space |
| * | put next to each other with no space |
| ^ | put the next bit in superscript |
| [] | put the bit in brackets in subscript |
plot(cars, xlab = expression("Speed (hr"^-1*")"),
     ylab = expression(bold(Distance[30])~"(ft)"))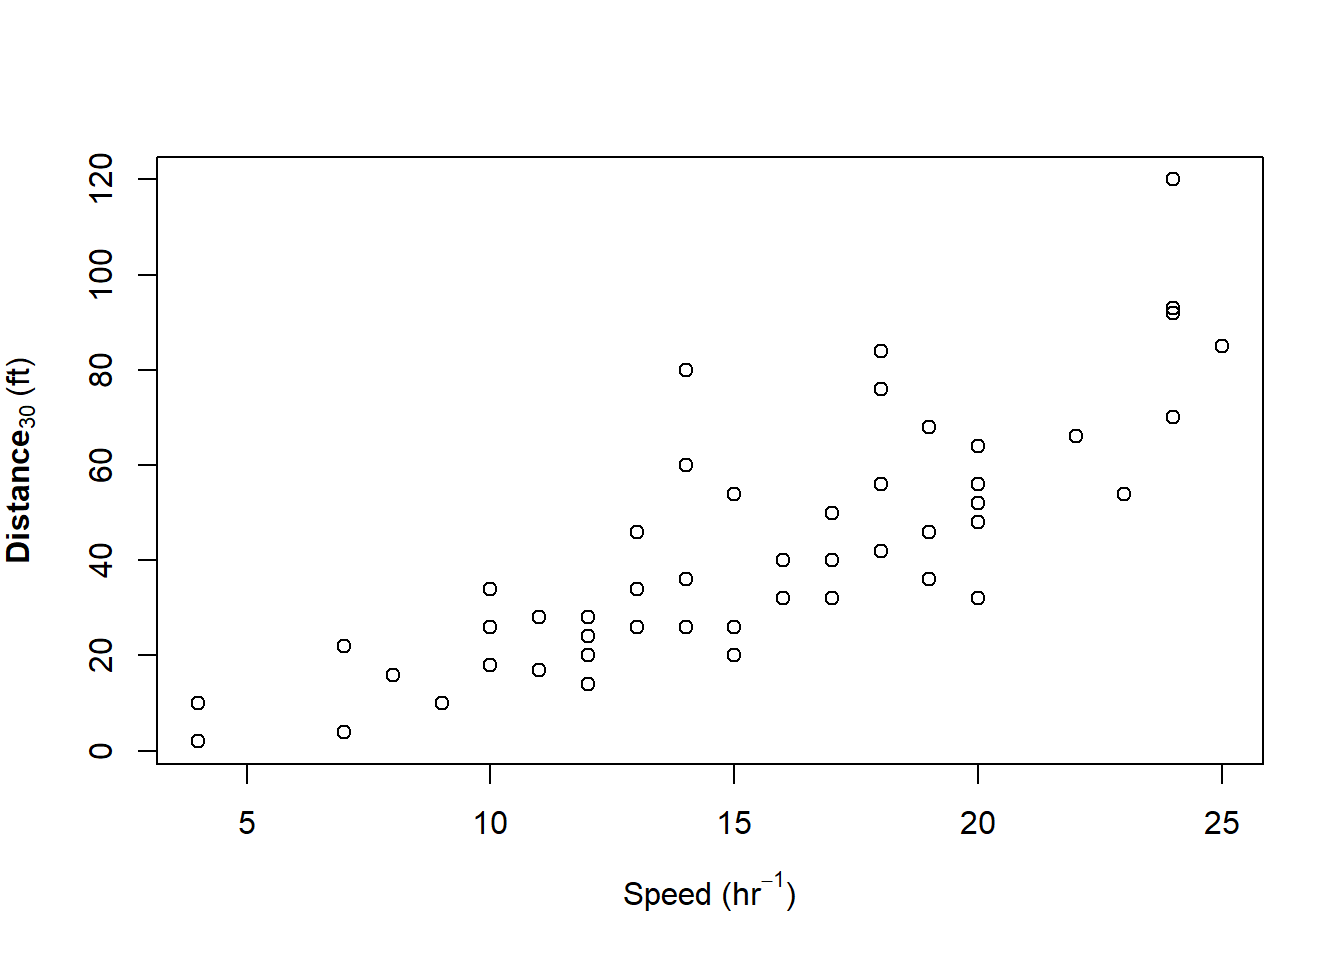
par(mar = c(5,5,4,2) + 0.1)
plot(cars, xlab = expression(pi~and~tilde(20)*degree),
     ylab = expression(infinity%down%N[2]*O-N))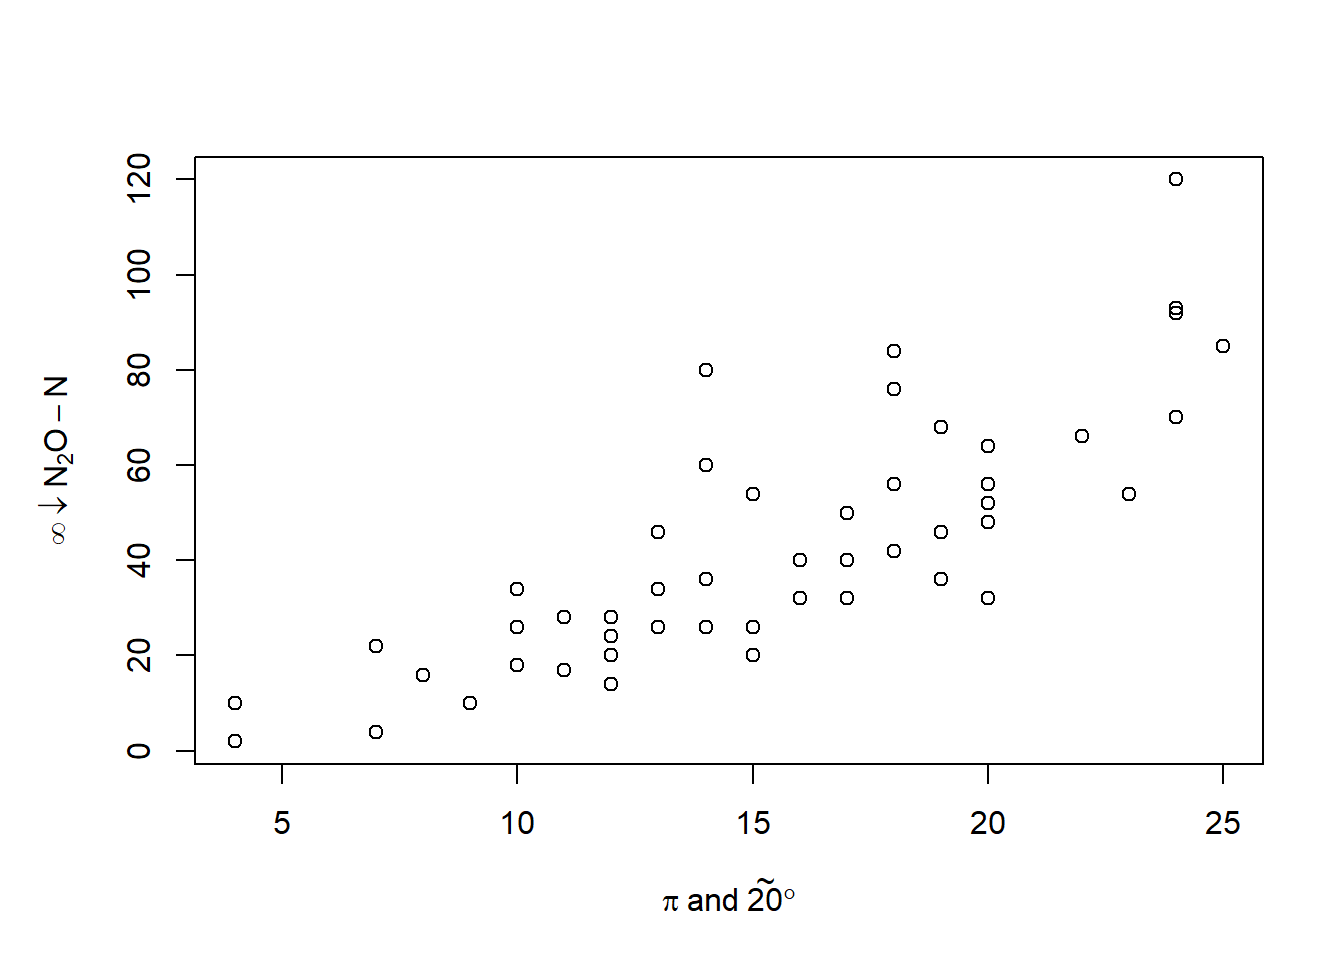
You can also reference unicode symbols directly, but not all are supported. I’m using “\u2030” here to show the per mille symbol.
par(mar = c(5,5,4,2) + 0.1)
plot(cars,
     ylab = expression(Delta^13*C-CO[2]~"(\u2030)"),
     xlab = expression(italic(A[380])~"("*mu*"mol"~CO[2]~m^-2~s^-1*")"))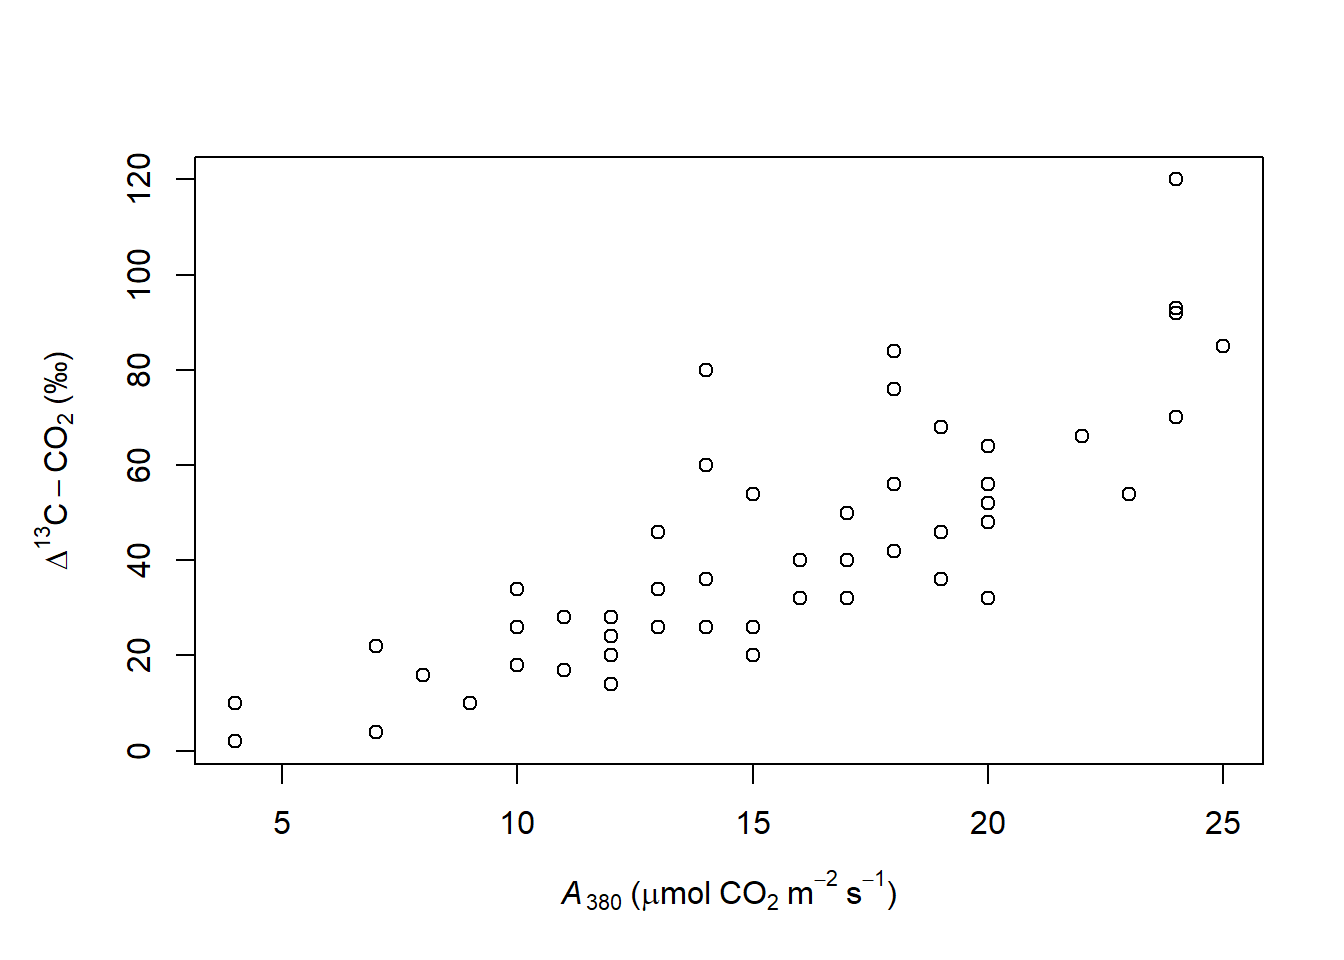
All of the above are possible in ggplot2, as shown below. You can also plot symbols directly onto the plot using expression within the labels value in geom_text.
library(ggplot2)
dat <- data.frame(X = gl(7,1),
                  Y = runif(7))

ggplot(dat, aes(x = X, y =Y)) + geom_bar(stat = "identity") +
  geom_text(aes(y = Y + 0.1),
            label = c(expression(alpha),
                      expression(beta), expression(gamma),
                      expression(delta), expression(epsilon),
                      expression(zeta), expression(eta))) +
  labs(x = expression(infinity %~~% frac(Upsilon1, widetilde(alpha*beta))),
       y = expression(Omega*bolditalic("(\u2020)")))
emojis because why not
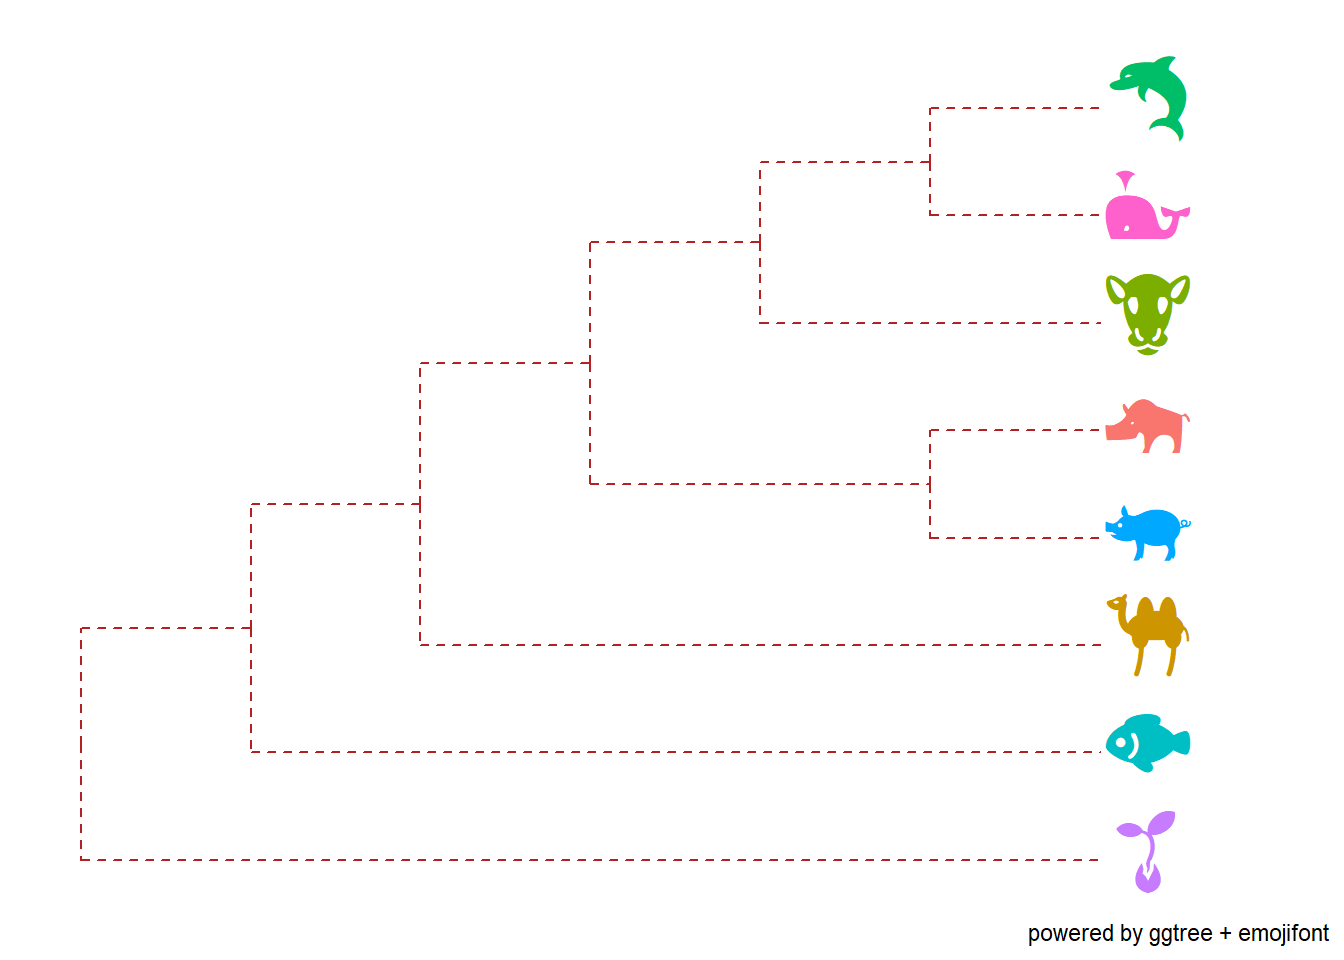
Also here is how to get emoji onto plots using the emojifont package, because I find this far too amusing. These examples are lifted directly from this comment on stack overflow and Guangchuang Yu’s vignette on phylomoji.
library(emojifont)

# data setup
df <- data.frame(name_emoji = c("closed book", "confused face","dizzy",
                                "face with tears of joy",
                                "flexed biceps", "light bulb"),
                      n = c(1L, 7L, 20L, 1L, 1L, 1L),
                      emoji = c("\U0001f4d5", "\U0001f615", "\U0001f4ab",
                                "\U0001f602", "\U0001f4aa", "\U0001f4a1"))

ggplot(df, aes(name_emoji, n, label = emoji)) +
  geom_bar(stat = "identity") +
  geom_text(family = "EmojiOne", size = 6, vjust = -.5) +
  scale_y_continuous(limits = c(0,25)) +
  theme(axis.title.x=element_blank(),
        axis.text.x=element_blank(),
        axis.ticks.x=element_blank())
library(ggtree)
tree_text <- "(((((cow, (whale, dolphin)), (pig2, boar)), camel), fish), seedling);"
x <- read.tree(text=tree_text)
ggtree(x, linetype="dashed", color='firebrick') +
  xlim(NA, 7) + ylim(NA, 8.5) +
  geom_tiplab(aes(color=label), parse='emoji', size=14, vjust=0.25) +
  labs(caption="powered by ggtree + emojifont")